Getting started
hrv-analysis
![]()

![]()
![]()
hrvanalysis is a Python module for Heart Rate Variability analysis of RR-intervals built on top of SciPy, AstroPy, Nolds and NumPy and distributed under the GPLv3 license.
The development of this library started in July 2018 as part of Aura Healthcare project, in OCTO Technology R&D team and is maintained by Robin Champseix.
Installation / Prerequisites
User installation
The easiest way to install hrv-analysis is using pip :
$ pip install hrv-analysis
you can also clone the repository:
$ git clone https://github.com/Aura-healthcare/hrv-analysis.git
$ python setup.py install
Dependencies
hrvanalysis requires the following:
- Python (>= 3.5)
- astropy >= 3.0.4
- future >= 0.16.0
- nolds >= 0.4.1
- numpy >= 1.15.1
- scipy >= 1.1.0
Quick examples
Outliers and ectopic beats filtering methods
This package provides methods to remove outliers and ectopic beats from signal for further analysis. Those methods are useful to get Normal to Normal Interval (NN-intervals) from RR-intervals. Please use this methods carefully as they might have a huge impact on features calculation.
from hrvanalysis import remove_outliers, remove_ectopic_beats, interpolate_nan_values

# rr_intervals_list contains integer values of RR-interval
rr_intervals_list = [1000, 1050, 1020, 1080, ..., 1100, 1110, 1060]

# This remove outliers from signal
rr_intervals_without_outliers = remove_outliers(rr_intervals=rr_intervals_list,
                                                low_rri=300, high_rri=2000)
# This replace outliers nan values with linear interpolation
interpolated_rr_intervals = interpolate_nan_values(rr_intervals=rr_intervals_without_outliers,
                                                   interpolation_method="linear")

# This remove ectopic beats from signal
nn_intervals_list = remove_ectopic_beats(rr_intervals=interpolated_rr_intervals, method="malik")
# This replace ectopic beats nan values with linear interpolation
interpolated_nn_intervals = interpolate_nan_values(rr_intervals=nn_intervals_list)
You can find how to use the following methods, references and more details in the documentation:
- remove_outliers
- remove_ectopic_beats
Features calculation
There are 4 types of features you can get from NN Intervals:
Time domain features : Mean_NNI, SDNN, SDSD, NN50, pNN50, NN20, pNN20, RMSSD, Median_NN, Range_NN, CVSD, CV_NNI, Mean_HR, Max_HR, Min_HR, STD_HR
Geometrical domain features : Triangular_index, TINN
Frequency domain features : LF, HF, VLF, LH/HF ratio, LFnu, HFnu, Total_Power
Non Linear domain features : CSI, CVI, Modified_CSI, SD1, SD2, SD1/SD2 ratio, SampEn
As an exemple, what you can compute to get Time domain analysis is :
from hrvanalysis import get_time_domain_features

 # nn_intervals_list contains integer values of NN-interval
nn_intervals_list = [1000, 1050, 1020, 1080, ..., 1100, 1110, 1060]

time_domain_features = get_time_domain_features(nn_intervals_list)

>>> time_domain_features
{'mean_nni': 718.248,
 'sdnn': 43.113,
 'sdsd': 19.519,
 'nni_50': 24,
 'pnni_50': 2.4,
 'nni_20': 225,
 'pnni_20': 22.5,
 'rmssd': 19.519,
 'median_nni': 722.5,
 'range_nni': 249,
 'cvsd': 0.0272,
 'cvnni': 0.060,
 'mean_hr': 83.847,
 'max_hr': 101.694,
 'min_hr': 71.513,
 'std_hr': 5.196}
You can find how to use the following methods, references and details about each feature in the documentation:
- get_time_domain_features
- get_geometrical_features
- get_frequency_domain_features
- get_csi_cvi_features
- get_poincare_plot_features
- get_sampen
Plot functions
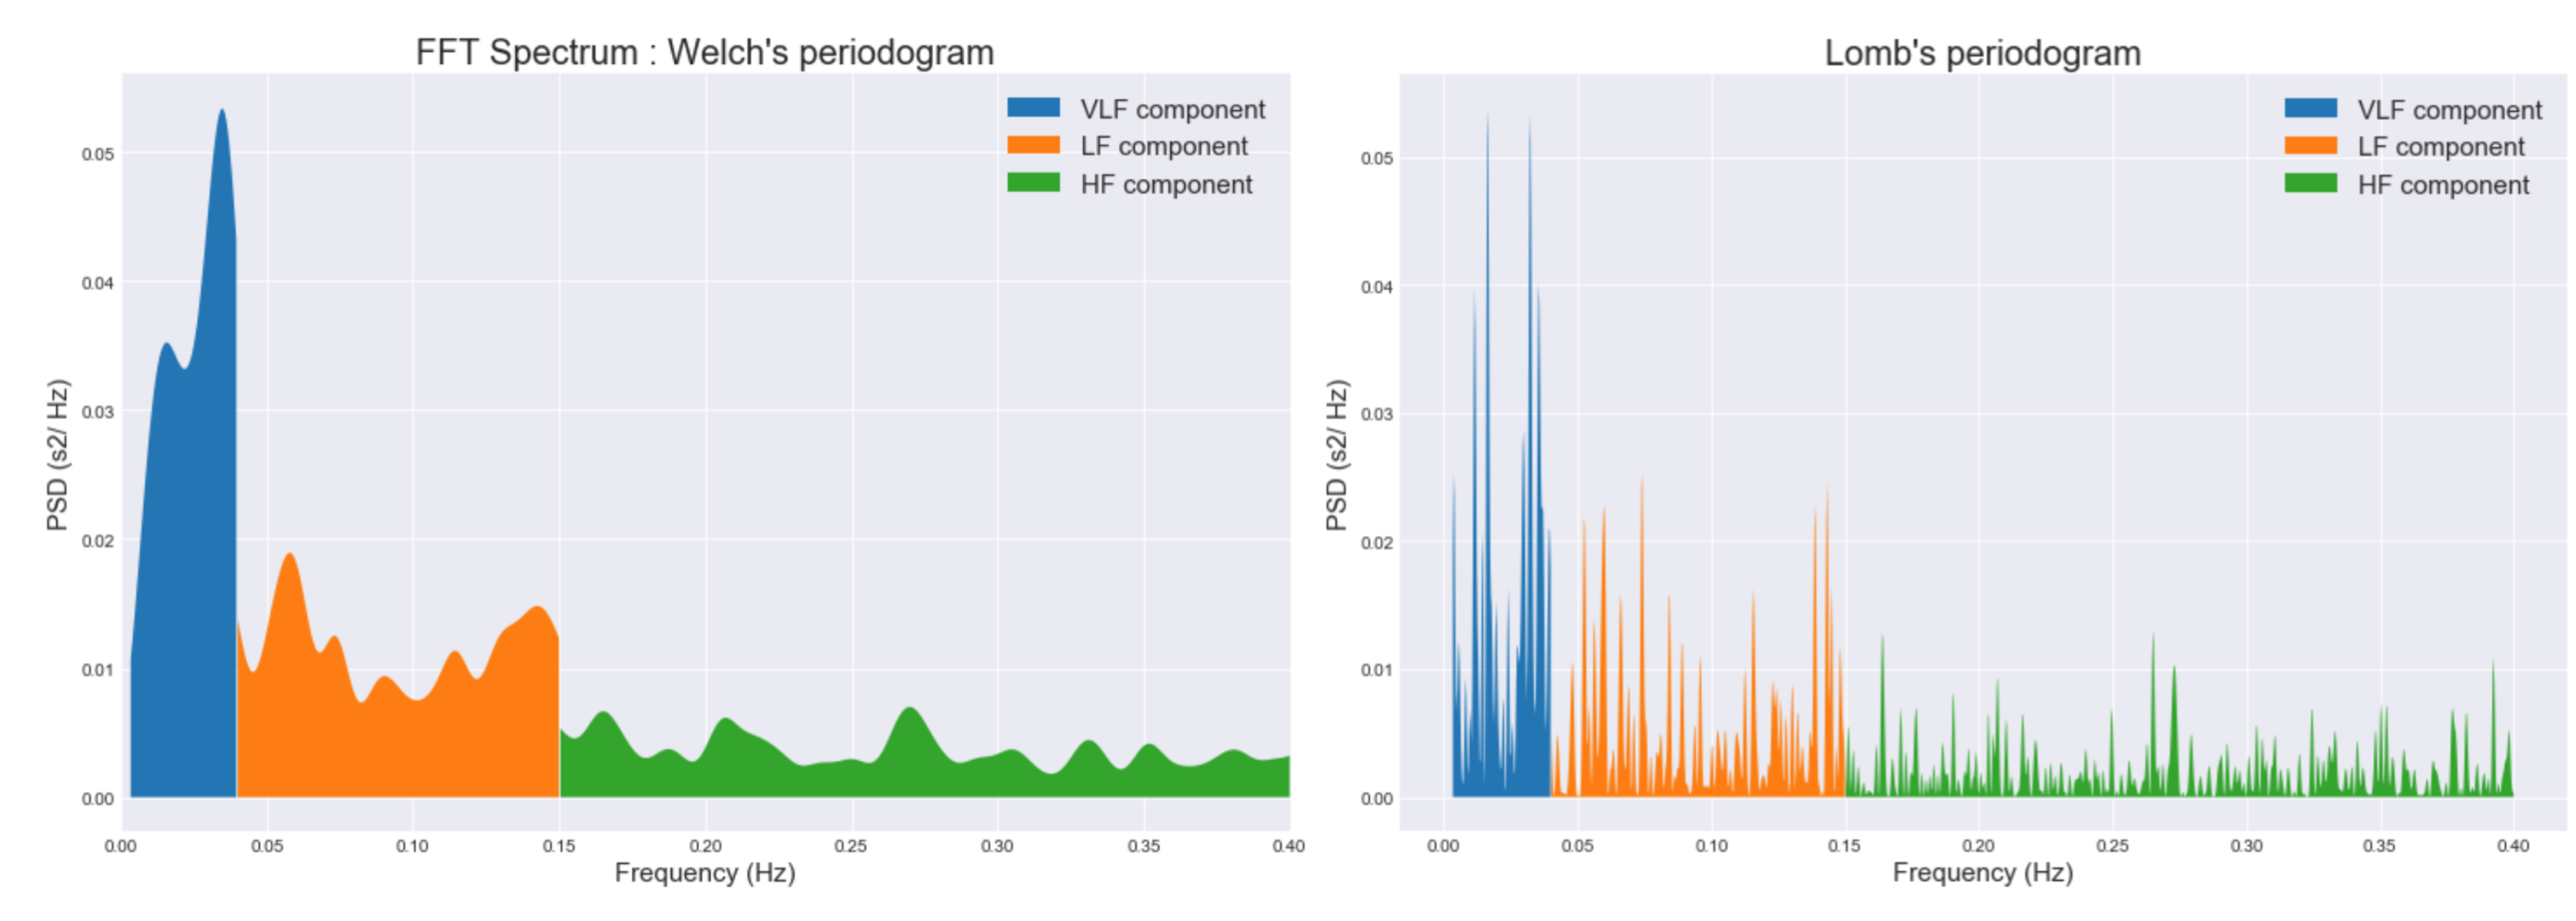
There are several plot functions that allow you to see, for example, the Power Spectral Density (PSD) for frequency domain features or Poincaré Plot for non linear domain features:
from hrvanalysis import plot_psd

# nn_intervals_list contains integer values of NN-interval
nn_intervals_list = [1000, 1050, 1020, 1080, ..., 1100, 1110, 1060]

plot_psd(nn_intervals_list, method="welch")
plot_distrib(nn_intervals_list, method="lomb")
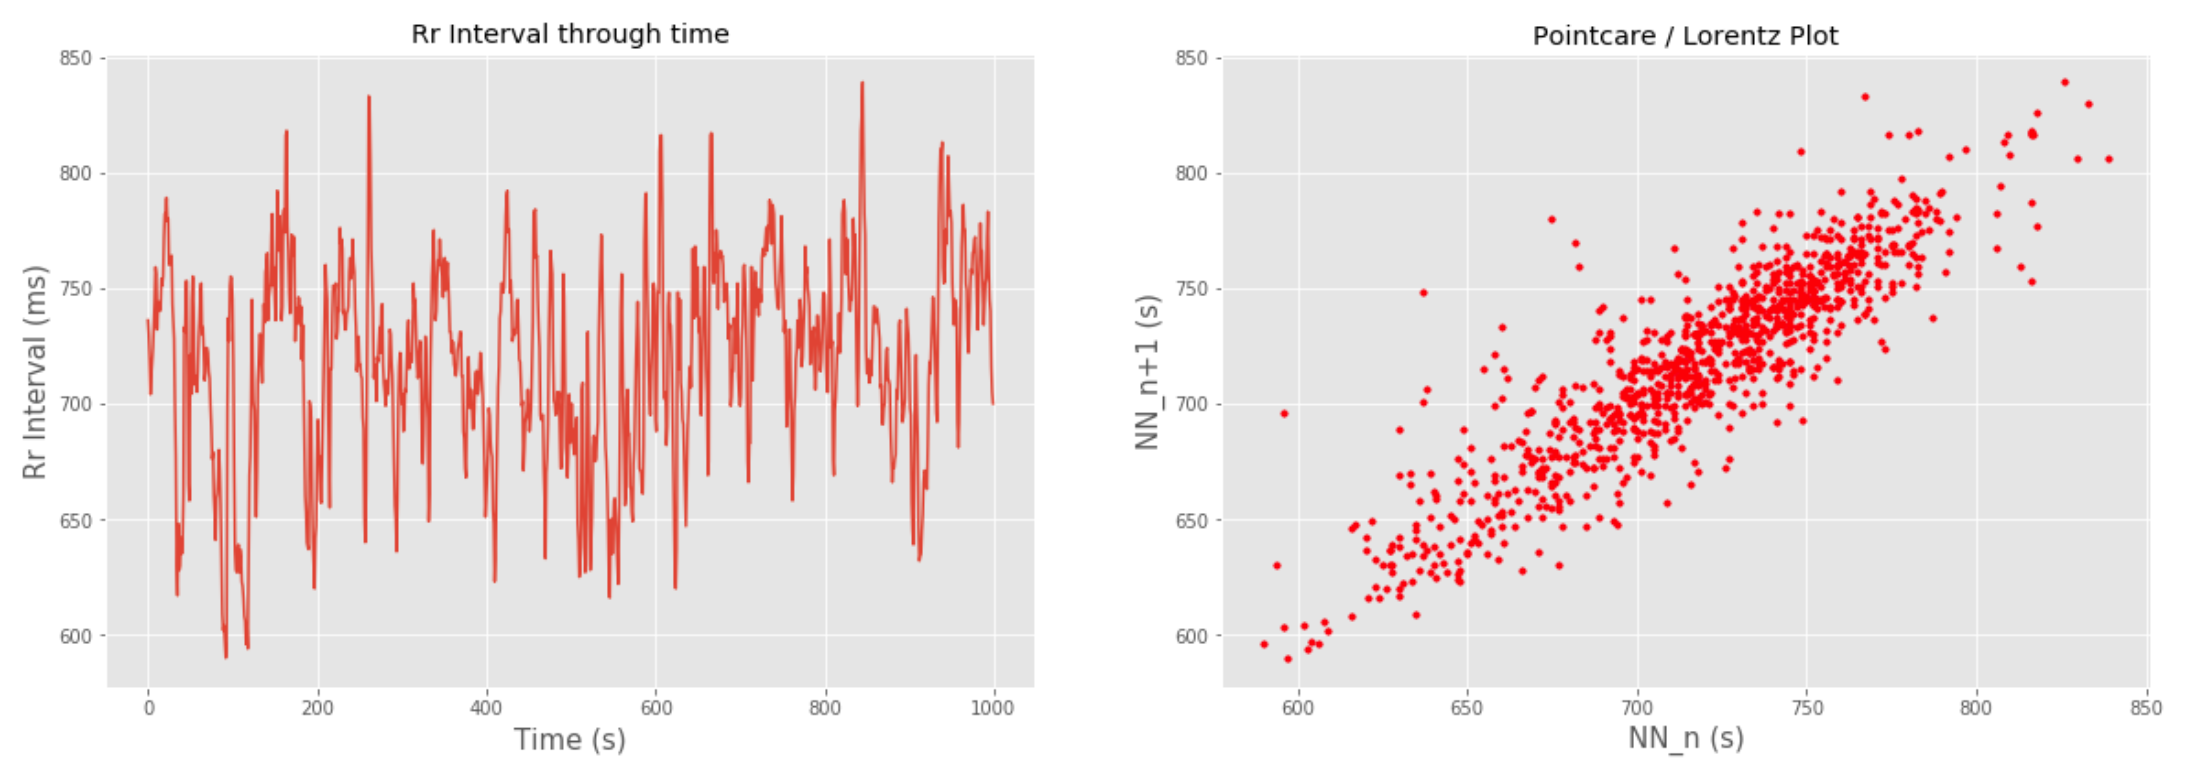
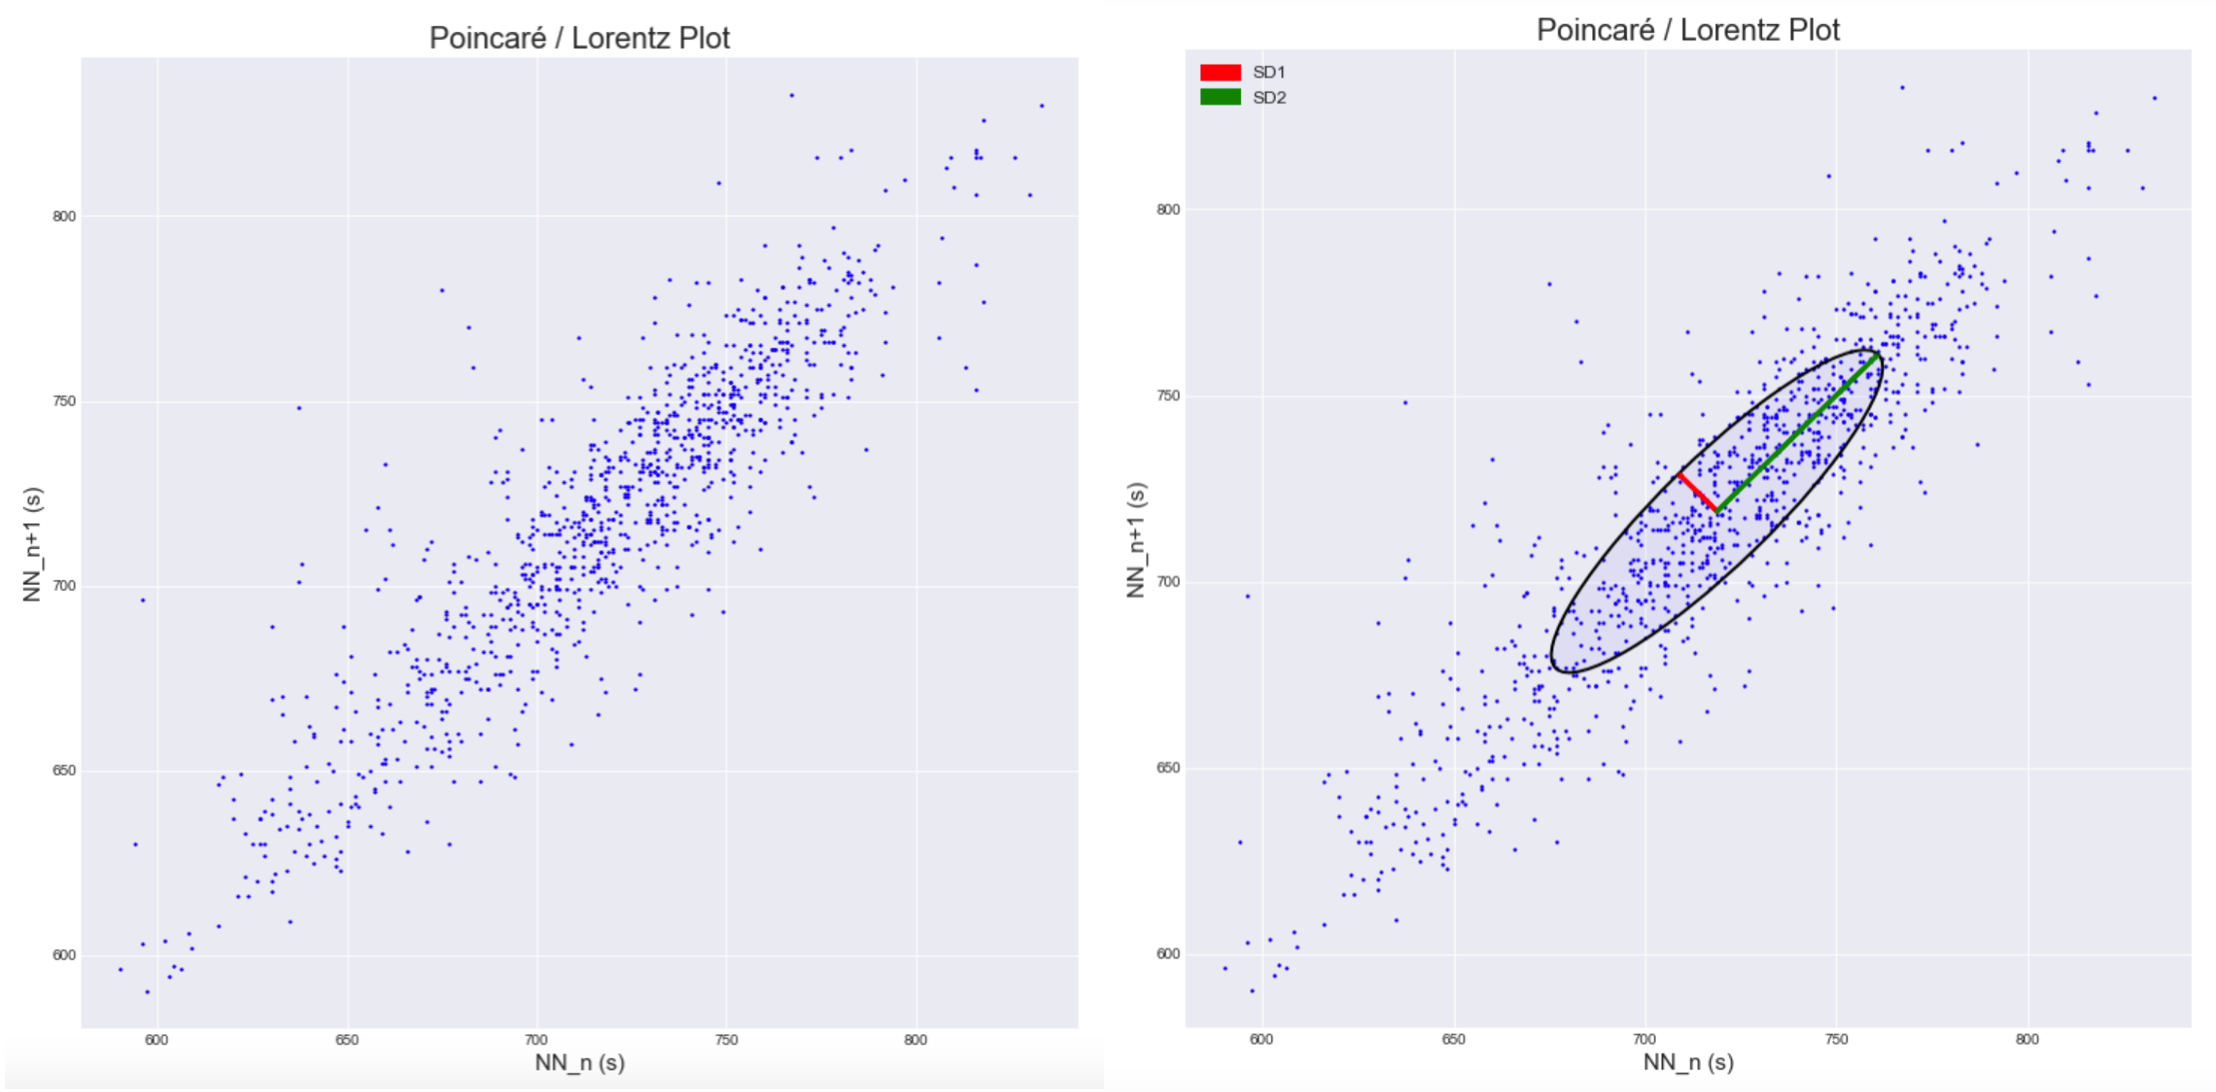
from hrvanalysis import plot_poincare

# nn_intervals_list contains integer values of NN-interval
nn_intervals_list = [1000, 1050, 1020, 1080, ..., 1100, 1110, 1060]

plot_poincare(nn_intervals_list)
plot_poincare(nn_intervals_list, plot_sd_features=True)
You can find how to use methods and details in the documentation:
- plot_distrib
- plot_timeseries
- plot_psd
- plot_poincare