API documentation
ecg_qc is a python library that classifies ECG signal to 0 = bad quality and 1 = good quality.
0 = bad quality corresponds to an ECG signal containing baseline shift, hight frequency noise which disturbs the QRS analysis.
1 = good quality corresponds to a clean ECG signal where the QRS can be perfectly detected.
EcgQc class
- class ecg_qc.ecg_qc.EcgQc(model_file='rfc_norm_2s.pkl', sampling_frequency: int = 256, normalized: bool = False)[source]
Bases:
objectThis class determines the quality of an ECG segment, usually lasting several seconds. It computes SQIs (Signal Quality Indicator) and use them in a pre-trained model to predict the quality:
1 : good quality
0 : bad quality
- model_file
Trained model to load to predict quality. Can be the name of included pre-trained model or a path to an other model.
- Type
str
- sampling_frequency
Sampling frequency of the input ECG signal. Used for several SQI computing
- Type
int
- normalized
If True, will normalise input ecg signal
- Type
bool
- predict_quality(sqi_scores)[source]
From a list of SQIs, predict the quality of a related ECG segment
- compute_sqi_scores(ecg_signal: list) list[source]
From an ECG Signal segment, computes 6 SQI scores (q_sqi, c_sqi, s_sqi, k_sqi, p_sqi, bas_sqi)
- Parameters
ecg_signal (list) – Input ECG signal
- Returns
sqi_scores – SQI scores related to input ECG segment
- Return type
list
- get_signal_quality(ecg_signal: list) int[source]
From an ECG segment signal, use pre-trained model to compute the quality of the signal. This method is a shortcut to using compute_sqi_scores then predict quality.
- Parameters
ecg_signal (list) – Input ECG signal
- Returns
prediction – The signal quality predicted by the model
- Return type
int
Frequency distribution sqi
Skewness
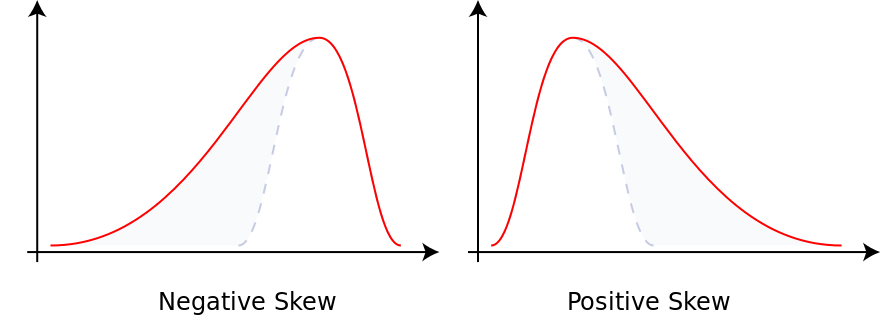
Skewness is a measure of the asymmetry of a distribution around its mean. It can be negative, null or positive. To describe the skewness, we compute the Pearson’s moment coefficient, corresponding to the third standardized moment.
https://en.wikipedia.org/wiki/Skewness#Pearson’s_moment_coefficient_of_skewness
- When we have
Symetrical distribution, the skewness coef = 0
Asymetrical distribution skewed on the left, the skewness coef is > 0
Asymetrical distribution skewed on the right, the skewness coef is > 0
Kurtosis
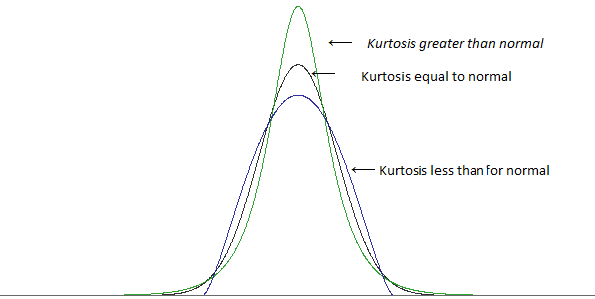
Kurtosis is a measure tailedness of the distribution around its mean. To describe the kurtosis, we compute the Pearson’s moment coefficient, corresponding to the fourth scaled moment. The excess kurtosis is defined as the kurtosis minus 3 (3 being the kurtosis coef of a normal distribution). The kurtosis can be positive or negative.
High excess kurtosis means that there are outliers far away from the distribution’s mean.
https://www.statext.com/android/kurtosis.html
- When we have
Mesokurtic distribution (black) : excess kurtosis = 0
Leptokurtic distribution (green) : excess kurtosis > 0
Platykurtic distribution (blue) : excess kurtosis < 0
- ecg_qc.sqi_computing.sqi_frequency_distribution.ksqi(ecg_signal: list) float[source]
Computes the excess kurtosis sqi.
Kurtosis represents how spread a distribution is.
Mesokurtic distribution : excess kurtosis = 0
Leptokurtic distribution : excess kurtosis > 0
Platykurtic distribution : excess kurtosis < 0
- Parameters
ecg_signal (list) – Input ECG signal
- Returns
k_sqi_score – rounded excess kurtosis sqi score
- Return type
float
- ecg_qc.sqi_computing.sqi_frequency_distribution.ssqi(ecg_signal: list) float[source]
Computes the skewness sqi.
Skewness represents how asymetrical a distribution is.
Symetrical distribution : skewness = 0
Asymetrical distribution skewed on the left : skewness < 0
Asymetrical distribution skewed on the right : skewness > 0
- Parameters
ecg_signal (list) – Input ECG signal
- Returns
s_sqi_score – rounded skewness sqi score
- Return type
float
Power spectrum sqi
Power spectrum distribution of QRS Wave
The energy of the QRS wave is computed on frequencies ranging from 5Hz to 15Hz (the energy of the QRS wave is concentrated in a frequency band centered at 10 Hz and is 10 Hz in width), the energy of the ECG signal is computed on frequencies ranging from 5Hz to 40Hz. .
If interference exists, the high-frequency component increases, and pSQI decreases.
Let’s take the following clean ECG signal. The computed psqi = 0.07.
Let’s now take an ECG with high frequencies noise. The computed psqi = 0.3.

Relative power in the Baseline
It corresponds to the ratio of the energy of the QRS wave and the energy of the ECG signal. The energy of the baseline is computed on frequencies ranging from 0Hz to 1Hz, the energy of the ECG signal is computed on frequencies ranging from 0Hz to 40Hz.
If there is no baseline drift interference, the basSQI value is close to 1. An abnormal shift in the baseline causes the bassqi to decrease.
Let’s take the following clean ECG signal. The computed bassqi = 0.99.
Let’s now take an ECG with important baseline shift. The computed bassqi = 0.97.

- ecg_qc.sqi_computing.sqi_power_spectrum.bassqi(ecg_signal: list, sampling_frequency: int) float[source]
Computes the relative power in the Baseline.
It corresponds to the ratio of the energy of the QRS wave and the energy of the ECG signal. The energy of the baseline is computed on frequencies ranging from 0Hz to 1Hz, the energy of the ECG signal is computed on frequencies ranging from 0Hz to 40Hz.
If there is no baseline drift interference, the basSQI value is close to 1. An abnormal shift in the baseline causes the bassqi to decrease.
- Parameters
ecg_signal (list) – Input ECG signal
sampling_frequency (list) – Input ecg sampling frequency
- Returns
bas_sqi_score
- Return type
float
- ecg_qc.sqi_computing.sqi_power_spectrum.psqi(ecg_signal: list, sampling_frequency: int) float[source]
Computes the power spectrum Distribution of QRS Wave.
It corresponds to the ratio of the energy of the QRS wave and the energy of the ECG signal. The energy of the QRS wave is computed on frequencies ranging from 5Hz to 15Hz, the energy of the ECG signal is computed on frequencies ranging from 5Hz to 40Hz.
If interference exists, the high-frequency component increases, and pSQI decreases.
- Parameters
ecg_signal (list) – Input ECG signal
sampling_frequency (list) – Input ecg sampling frequency
- Returns
p_sqi_score
- Return type
float
R-R interval sqi
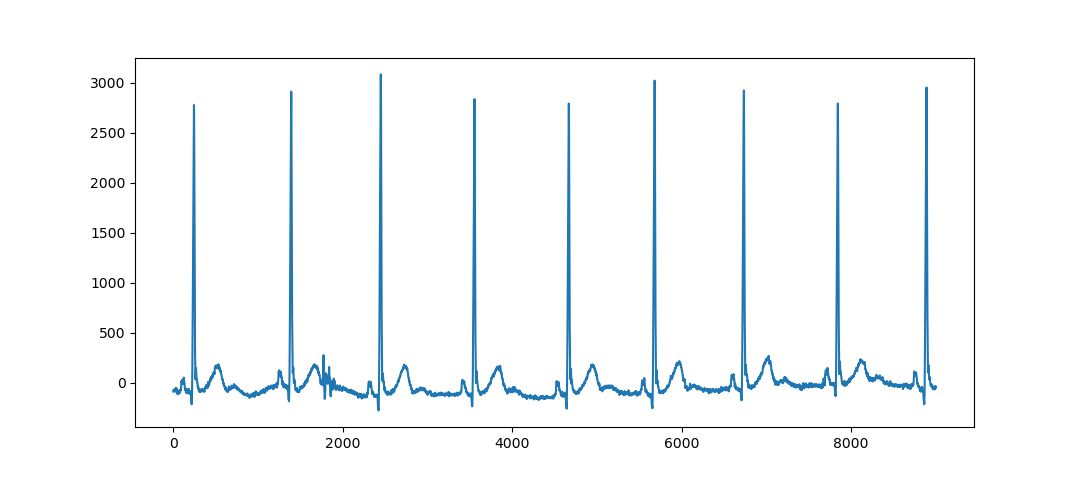
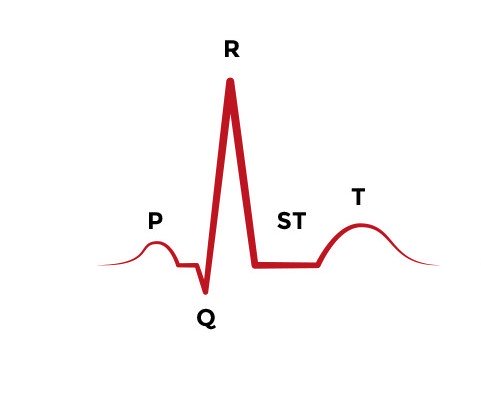
An ECG signal is a periodic signal composed of P, Q, R and T wave.
https://www.aclsmedicaltraining.com/basics-of-ecg/
R wave has the maximum amplitude and most obvious characteristic so we often characterize the ECG signal by R wave detection.
- ecg_qc.sqi_computing.sqi_rr_intervals.compute_qrs_frames_correlation(qrs_frames_1: list, qrs_frames_2: list, sampling_frequency: int, matching_qrs_frames_tolerance=50) float[source]
- ecg_qc.sqi_computing.sqi_rr_intervals.csqi(ecg_signal: list, sampling_frequency: int) float[source]
Variability in the R-R Interval
When an artifact is present, the QRS detector underperforms by either missing R-peaks or erroneously identifying noisy peaks as R- peaks. The above two problems will lead to a high degree of variability in the distribution of R-R intervals;
- Parameters
ecg_signal (list) – Input ECG signal
sampling_frequency (list) – Input ecg sampling frequency
- Returns
c_sqi_score
- Return type
float
- ecg_qc.sqi_computing.sqi_rr_intervals.qsqi(ecg_signal: list, sampling_frequency: int) float[source]
Matching Degree of R Peak Detection
Two R wave detection algorithms are compared with their respective number of R waves detected.
Hamilton
SWT (Stationary Wavelet Transform)
- Parameters
ecg_signal (list) – Input ECG signal
sampling_frequency (list) – Input ecg sampling frequency
- Returns
q_sqi_score
- Return type
float